E-learning concepts - Table of Content
Web 2.0
Concept Map
 Learning Objectives
When you have completed this session, you should be able to
- identify mind maps and concept maps as tools of visualization,
- list the basic principles of map design,
- apply Web 2.0 tools for designing mind maps,
- identify and apply Web 2.0 visualization tools in practice,
- discover the possibilities of using mind maps in pedagogy.
 Reading
Concept Maps & Mind Maps
Have you thought of something and drew a picture while doing so? Visualization can help you get closer to a solution to an issue or problem. Pictures and figures can help with orientation. The expression "a picture is worth a thousand words" is undoubtedly true at times!
Technical developments and project management cannot be imagined without drawings and figures. Programmers and engineers model different steps in any development with flowcharts; Project managers use Gantt-diagrams for timing.
The visual method of drawing mind maps is relatively a new concept, but it can have a very wide application -- perhaps more so that in those areas mentioned above. It can also be useful for problem solving, clarifying concepts or ideas, and understanding phenomena or procedures.
This technology was developed in 1960 by Joseph D. Novák, Professor at Cornell University. He was looking for a problem solving method to help with adding or connecting new knowledge to existing knowledge patterns. He started from the concept that understanding new notions is much easier if connections are discovered between the existing and new knowledge.
"Comprehensive learning can embed new concepts into existing cognitive structures."
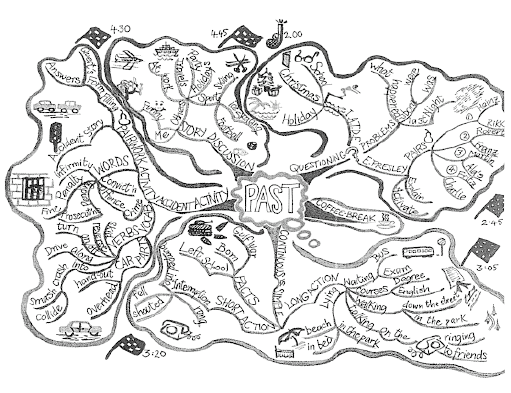
Widespread use of mind mapping in the 70s was attributed to the English psychologist and education consultant, Tony Buzan. His book, published in 2002, started an innovative avalanche in the field of mind map software. The handmade mind map (above), which was created by teachers in an English language school, is taken from his book (click for a more detailed version). It is possible that the 'net generation' could make spectacular, creative mind maps with Web 2.0 tools.
Drawing made simple!
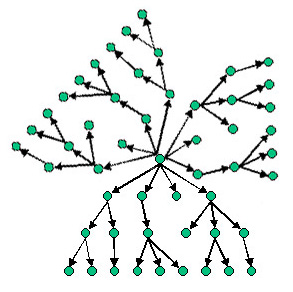
Draw small junctions - small circles for instance - on a piece of paper and connect them with lines. Give names to the junctions and replace the circles with simple images. To the end of connecting lines - one or the other or both - draw arrows. You will end up with a construction similar to this:

Each junction can be the start point for one or more connecting lines, which can lead to other, new junctions -- until a tree or a net is created.
 |
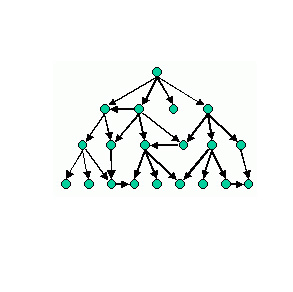 |
| Hierarchic structure | Network structure |
These schematic figures cannot represent the creativity of figures that can be created from these simple elements. It is not easy to show the complexity of human thinking in a linear way. Concepts and keywords describing the subject can occupy the nodes. Lines represent connections between them.
Both stuctures -- hierarchy and network -- are known and have been used in mathematics and software development for many years (mainly in the theory of data storing technology and databases). There is a separate branch of mathematics, called graph-theory, dedicated to network structures.
What are the applications of Maps?
Brainstorming
We are all familiar with Brainstorming. This starts out with a seemingly good idea, but one that lacks clarity and direction. Participants take the idea and build on it, expand it and define it.
Designing sophisticated systems: analyzing complex problems
Mind Maps can be useful for private application and for teamwork, but also where new and complex systems have to be introduced in an institution when it is difficult to see the detail in different segments of the task. Design can develop by drafting the most important elements of a large plan, and gradually adding detail by ever depening analysis.
Drawing Maps can help to uncover badly defined points, can provide a framework for clarifying what is understood, and for highlighting what has yet to be clarified.
Concept systems: illustrating taxonomies
Visualizing taxonomies can be useful in understanding, or making understood, the conceptual structure of a given topic and for showing connections between concepts.
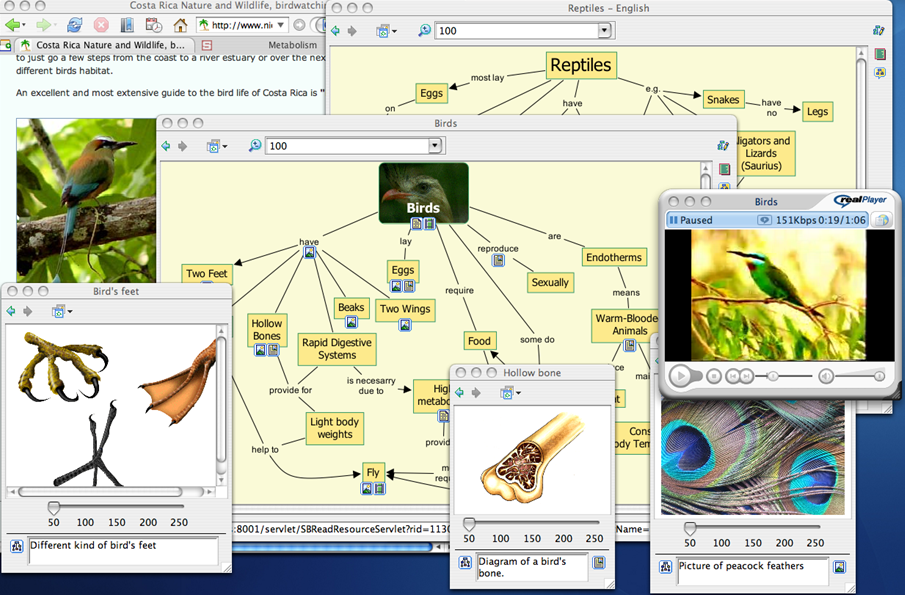
Opportunity is limited to one's imagination. Maps can use texts, images, and lines -- which can help with the overall understanding or in clarifying explaination for others. The scientific literature differentiates between mind maps and concept maps. Mind maps (or comprehension maps) are mainly useful for solving problems and for design work. Concept maps are recommended for visualizing the taxonomy within some topics. A Net structure is recommended for concept maps, while hierarchic maps are recommended for mind maps.
How are they drawn?
Drawings can be created by hand on a piece of paper or on a board. It is not necessary to use a computer. Here are a few tips and ideas to make drawing easier.
- Start drawing from the center of the page and continue by creating branches.
- Use as many images and figure as many possible for illustrating keywords.
- The center of the drawing should be visually strong (and pictorial?).
- Add words and notes on the connecting lines.
- Use different font sizes (small letters, capital letters) and colours for highlighting notes.
- Use arrows for illustrating connections.
- Do not stick to one area; if you get tired of one branch work on another.
- A Map should fit onto one A4 (letter size) sheet.
- Be creative and embrace humour!
Software drawing tools
Many software packages exist for drawing comprehesion maps, and many of them are freeware. (See: http://www.mind-mapping.org/web-based-mindmappers/summary.html ). These include:
- MindManager (commercial)
- FreeMind (freeware)
- Microsoft Visio (commercial)
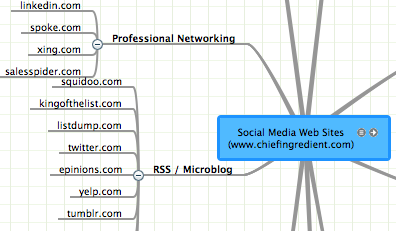
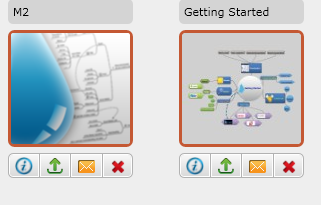
Web 2.0 applications support co-operation and content sharing for designing solutions. Tenegen has trialed Mindmester and DropMind, both of which have options for inviting others to co-operate in designing maps.
 |
 |
| MindMeister http://www.mindmeister.com |
DropMind http://www.dropmind.com |
 Exercises
The picture below is an "embedded" Mindmeister Map which you can investigate in detail. Using the icons to the bottom of the picture you can perform various options, e.g. switch to full screen and move within the map. 1. Visit the Mindmeister website and watch its video tutorials to learn how to use it. (There is a ready-made account on the Mindmeister: user - tenegen; password - tenegen555). Try to create your own map, and write your experiences in your blog!
2. Do you think your students could be persuaded to create a comprehension map for themselves for a given topic?
3. Visit this site: http://mappio.com/ and look at the examples. Write your impressions of them in your diary, and say how you might use the examples in your own subject area.
References
1. Buzan, T. és Buzan, B.: Das Mind-Map Buch. MVG Verlag. Heidelberg, 2002
2. A COMPARATIVE SURVEY ON MIND MAPPING TOOLS
Turkish Online Journal of Distance Education-TOJDE July 2009 ISSN 1302-6488 Volume: 10 Number: 3 Article 2
3. Here is an interestingpresentation about comprehensive maps that is worth watching: http://www.slideshare.net/fredmiller/mind-mapping-copy-presentation.
4. More examples: https://www.novamind.com/cloud/doc/list
